Blog
Klevu’s Black Friday Insights: 2020
Introduction
First, we hugely thank all our customers for using Klevu. Black Friday (BF) 2020 is now behind us with continuing exceptionally different circumstances around all of us. They turned the table upside down in the world of shopping. Online shopping at least for some time has become the de facto way to explore and purchase products, services and even experiences. On a positive note, the very possibility of online shopping allowed us to remain safe and continue to be responsible. We present our findings from BF shopping trends on Klevu served events. We will further append the article in coming days and weeks with more insights into festival season.
It is no surprise that the BF 2020 brought staggering numbers across shopping verticals. We served 68% more shopping interactions. The comparison against 2019 looks a bit biased as the context around shopping has changed. However, we are proud to share that Klevu AI brought a 25% higher conversion to our customers. In terms of traffic, we saw North America leading at the helm with 8.2 Million plus events recorded, while Africa saw the highest growth this year.
As a Klevu customer, if subscribed to an applicable plan, you can also see Live View inside Klevu Merchant Center.
Please find more collective insights from Klevu Analytics in this article and stay tuned for more insights :).
Background
We cover 36 hours of data analysis for Black Friday starting 00:00 GMT on Nov 27 to 12:00 GMT on Nov 28. Klevu dissected numbers at various data points including and not limited to region/location, devices, revenue and industry domains. Here are some cumulative numbers for Black Friday 2020. All figures presented in this report are based on the analysis of tracked events on the Klevu powered stores.
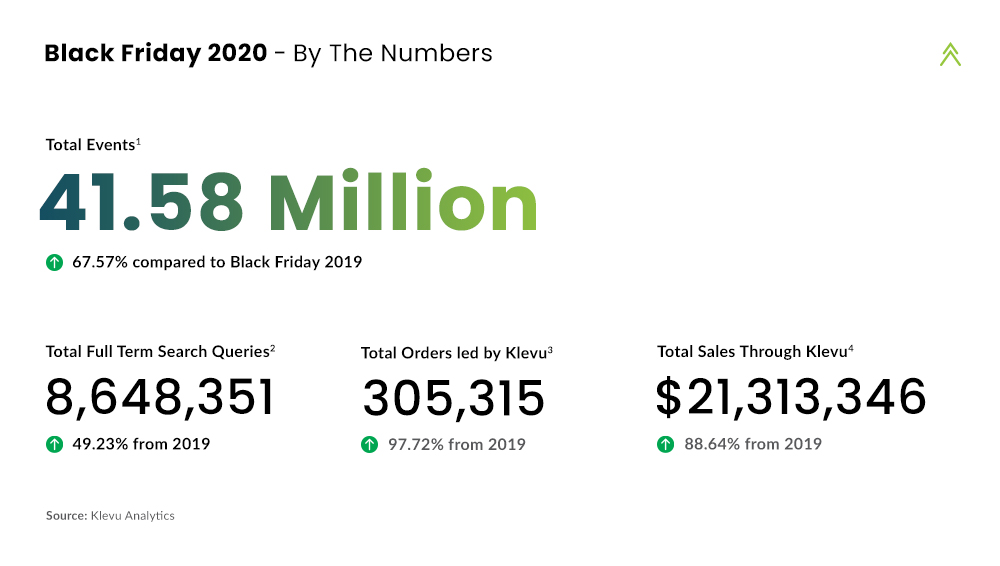
“Black Friday 2020 recorded 88% increase in Klevu led sales compared to Black Friday 2019″
Click Throughs & Conversions
Click through rate saw an increase of 11% compared to 2019 Black Friday, while click conversion rate ramped up to 7.5% compared to last year depicting a growth of 18%. Klevu’s contribution to sales for 2020 saw a 25% increase from last year.
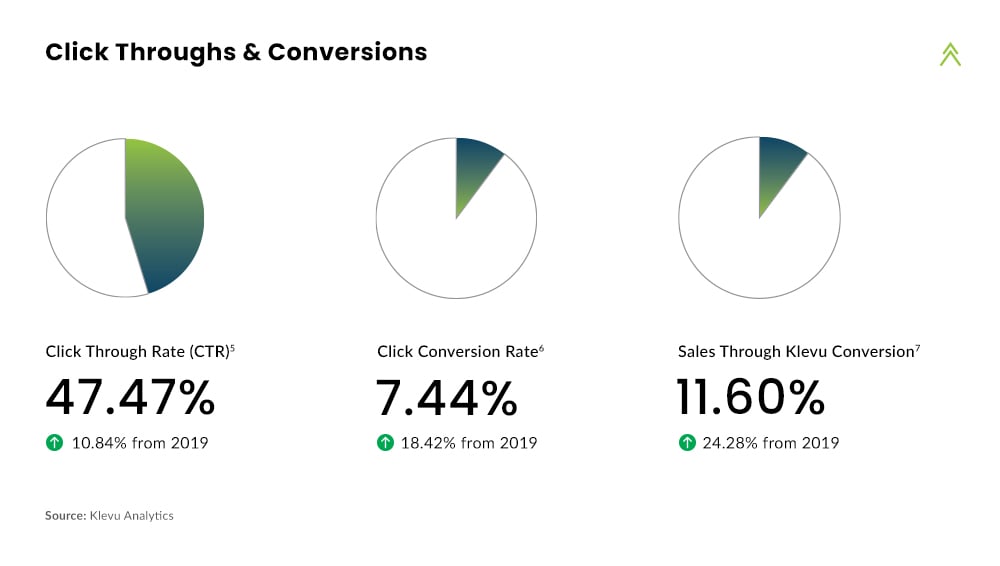
“Klevu Sales Conversion Rate increased by 25% on Black Friday 2020 compared to 2019″
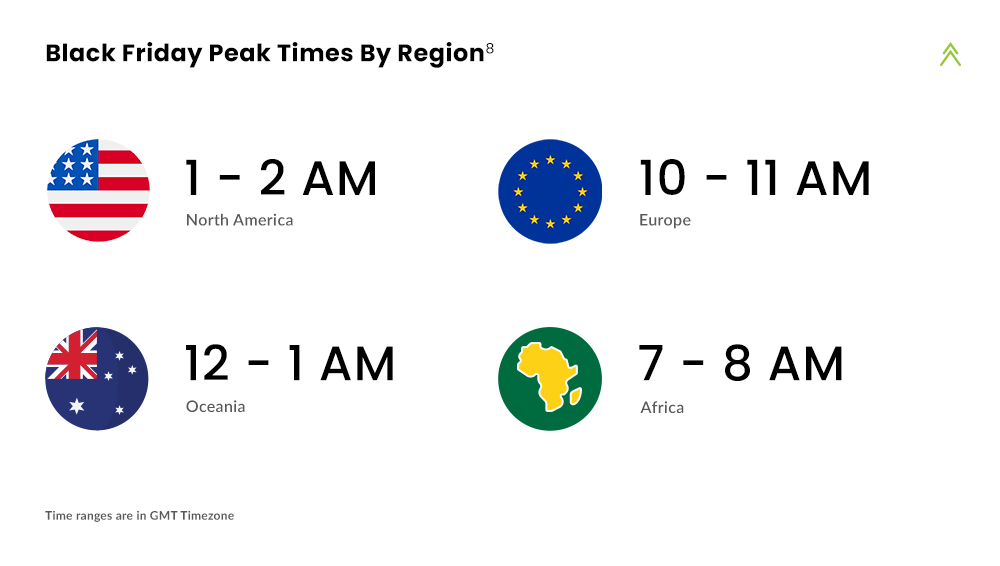
“Shoppers in USA placed most orders in the evening between 8 – 9 PM PST , while in the UK, peak period was during morning time between 10 – 11 AM GMT“
Device Usage Trends During Black Friday
We noticed that the shopping holiday traffic was massively driven by mobile devices, with over 52% of events recorded from smartphones alone, however a decline of 6% when compared to 2019. We saw a total Increase in mobile traffic by 77%, but the increase in desktop traffic was a staggering 111%. Desktop searches also saw an increase by 15% compared to last year. The year 2020 also indicated slight increase in tablet traffic accounting for about 1 Million searches.
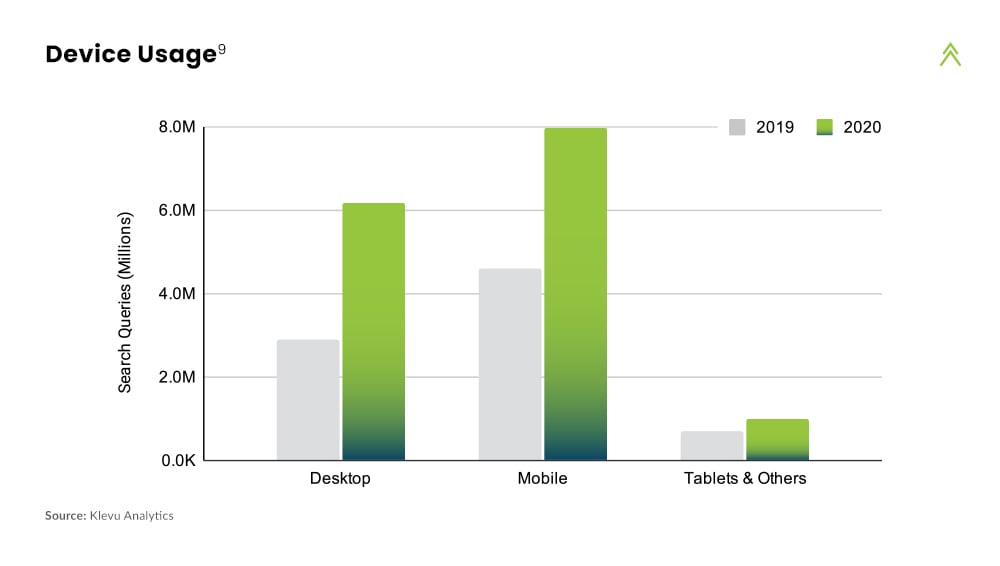
“Mobile devices dominated traffic, accounting for over 52% share during Black Friday 2020″
Top Countries
We saw an unprecedented Click through rate of 134%, 80% and 77% in Serbia, Croatia and Poland, respectively. However, the highest click conversion was recorded in Ireland with a ratio of 18% followed by the UK and Malta at 17% and 16% respectively. Click through rate, globally, on an average increased by 11% and conversion globally showed a change of 25% compared to last year.
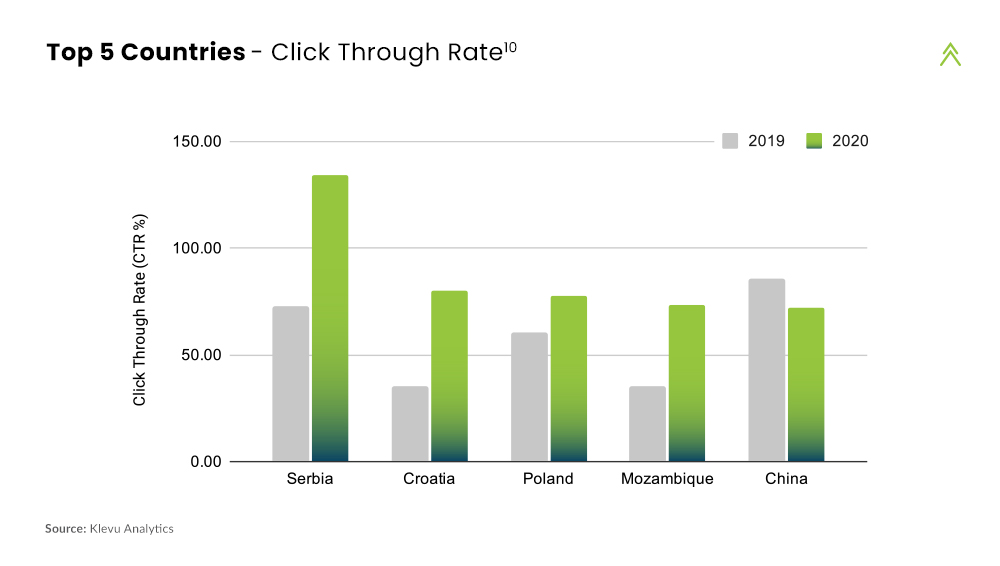
“European region saw the highest CTR, with Serbia leading the pack at 134%”
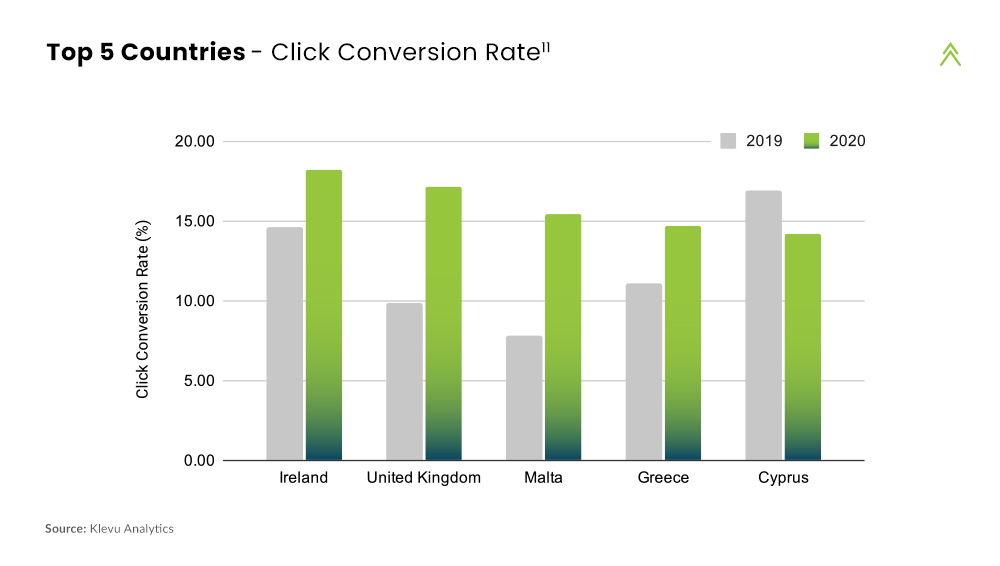
“Ireland, United Kingdom and Malta topped the charts in terms of highest click conversions with Ireland recording 18%”
Top Industries by Region12
For this decade, online shopping trends have radically been wild in the retail industry. We decided to dissect data by regions to understand which retail industries drive revenue around the world.
2020 saw Electronics dominating globally with an astounding share of 25%, followed by the Home and Kitchen category accounting of a 22% share. The following charts show insights of the top five domain/industry spendings within each region.
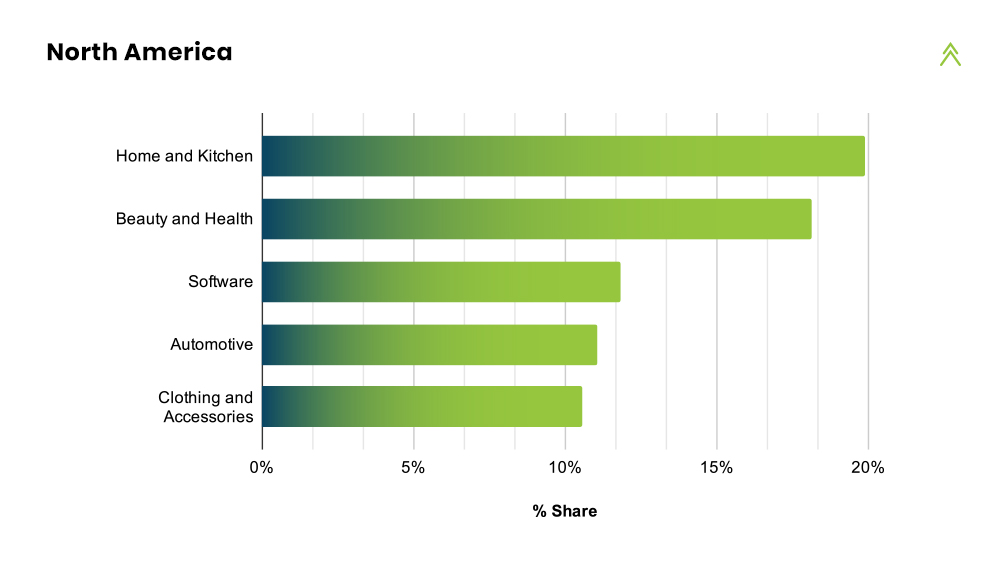
“Shoppers in North America spent the most on Home & Kitchen followed by Beauty & Health products with a total share of 38%“
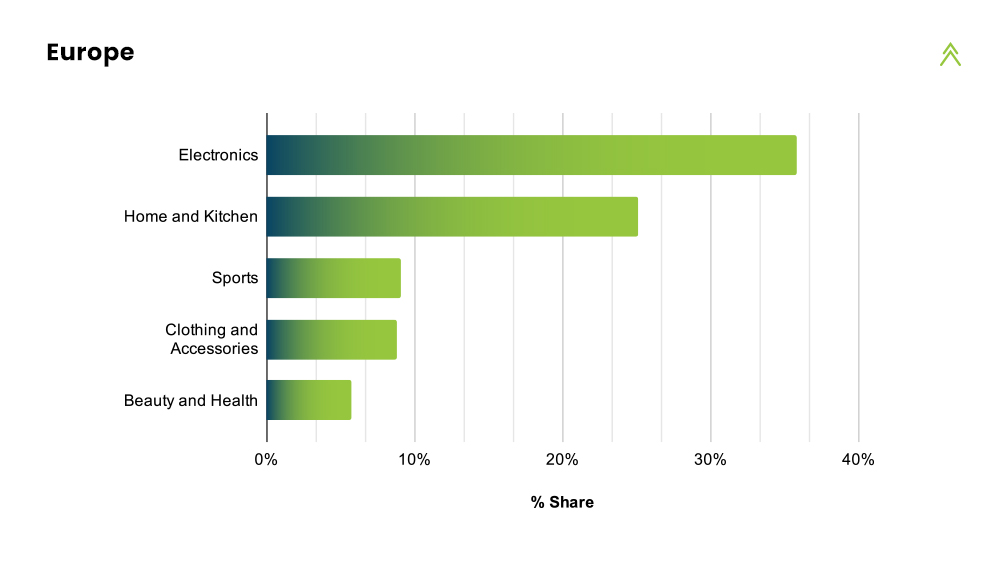
“The European shoppers spent the most on Electronics, Home & Kitchen & Sports products accounting for more than 70% of all categories”
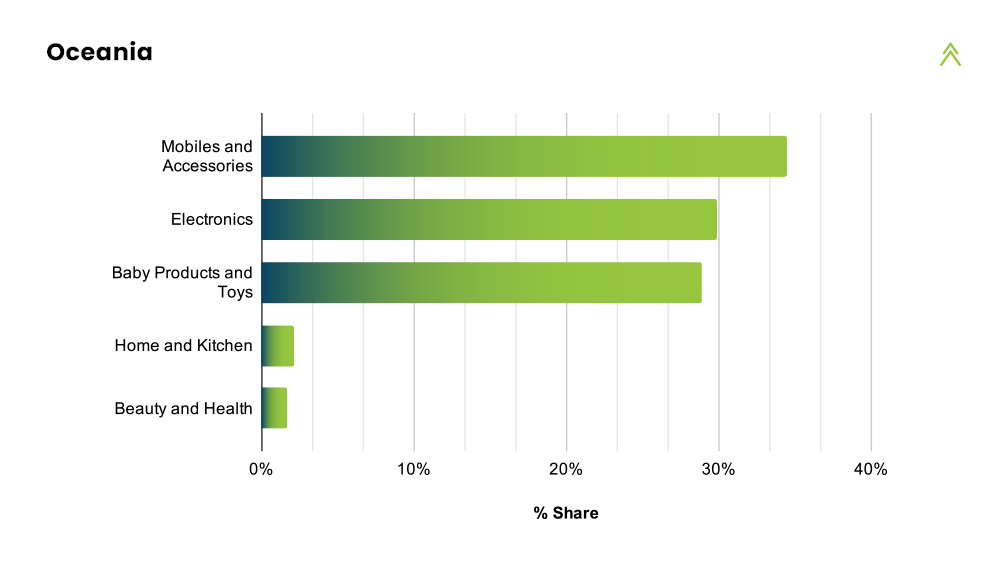
“90% of shopping in Australia and New Zealand was done on Mobiles, Electronics and Baby product categories”
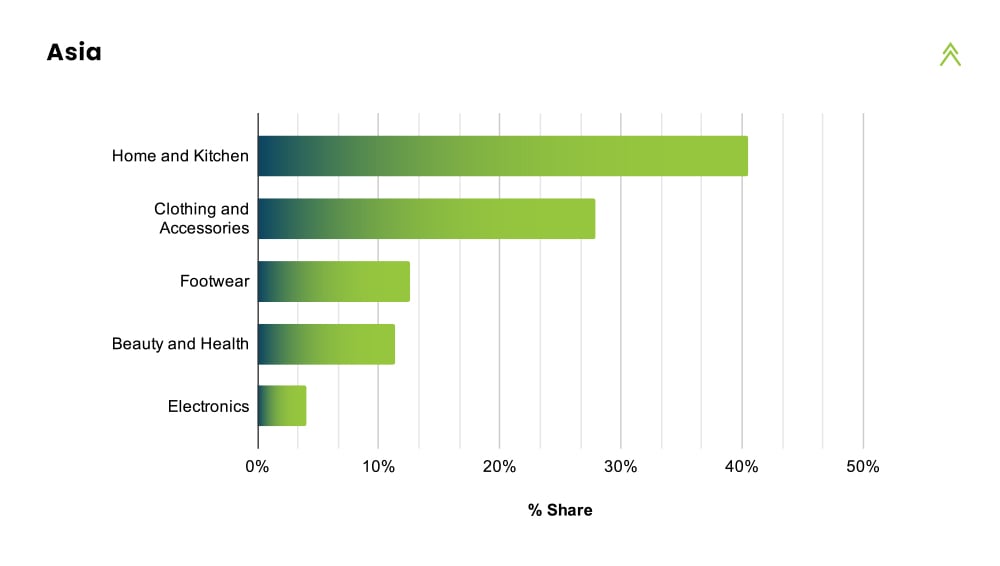
“Shoppers in Asia predominantly shopped within Home & Kitchen & Clothing product category”
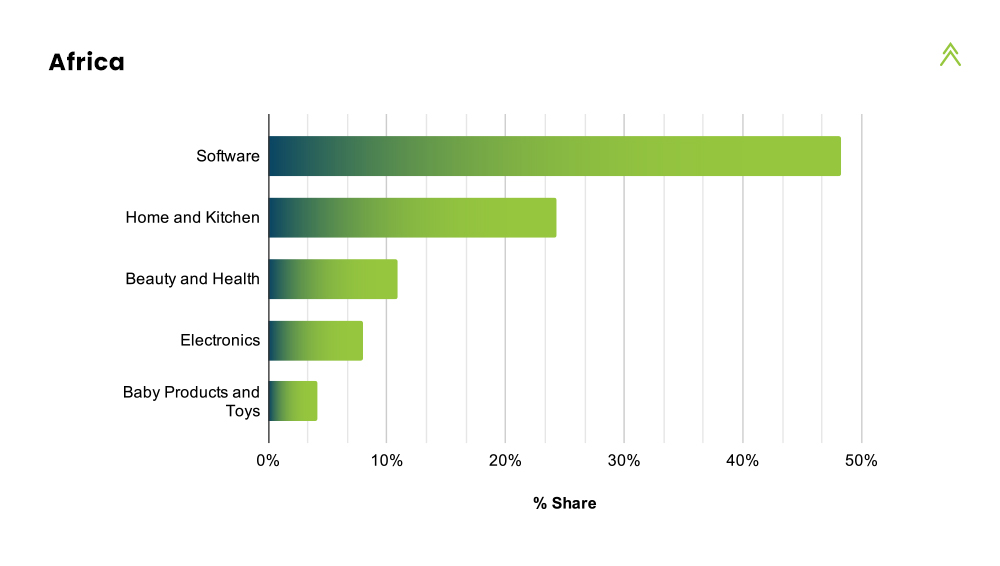
“Shoppers from Africa went tech this Black Friday, with over 55% of spendings seen in Software and Electronics“
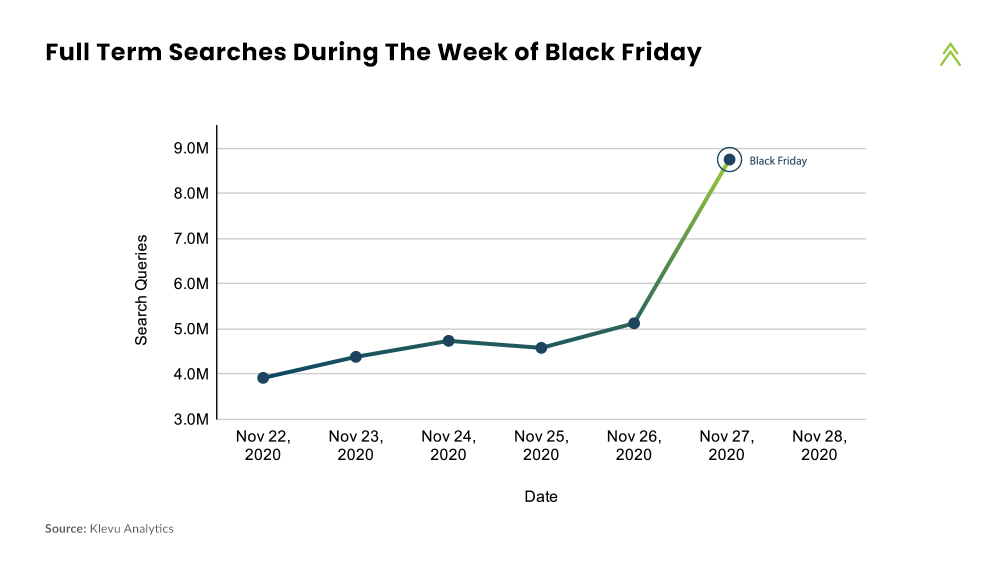
Search Trend During Thanksgiving Week
With many countries and regions continuing to impose restrictions on physical movement, many retailers adopted an early assortment of deals and discounts leading up to Black Friday. We noticed that the number of searches continued to rise during the thanksgiving week, with the most full term searches recorded on Black Friday 2020 at 8.6 Million searches.
Digitalisation has by far proven the most useful endeavour at this time as one of the most important discoveries. Online shopping demonstrates one of the most important phenomena of digitalisation and the numbers presented above are a clear evidence of the same.
The ability to discover and adapt allows us to continue to find novel ways of beating what may come on our way, be it pandemic or something else. We at Klevu are committed to democratising discovery for all retailers. For us, every day is important in ensuring we serve the best discovery experience to shoppers. Black Friday or other such events only allow us to strengthen our commitment and give us an opportunity to reflect on our ongoing work. It brings delight to us when shoppers find what they want, and our customers sell more through Klevu discovery experience.
We will continue to bring more insights and innovate further as we progress towards our commitment. Once again, we thank our customers, partners, team and suppliers who help us make things happen! Stay tuned 🙂
Footnotes
1) Total Events – Total events constitute keystrokes, full term searches, product clicks, category views and checkout events. 2) Total Full Term Search Queries – Full search term queries refer to events when a complete search query is entered. E.g. “gol” vs. “golden ring”. 3) Total Orders – Number is indicative for a data window from 00:00 GMT Friday, Nov 27 to 12:00 GMT Saturday Nov 28. 4) Total Sales Through Klevu – Revenue data tracked by Klevu corresponding to checkouts led by Klevu product clicks. FX used for USD conversion is rate as on Black Friday 2020. 5) Click Through Rate – The measure represents the ratio of users who click on products against how many times a search was made. 6) Click Conversion Rate – The ratio represents users who checked out against total users clicks from search results. 7) Sales Through Klevu Rate – Contribution of sales through Klevu against sales of the entire store. Note that sales through Klevu is only an indicative ratio and does not include refunds, order cancellations failed transactions or the checkouts not yet delivered to the Klevu analytics backend. 8) Black Friday Peak Times by Region – Time window where most orders were received in a region. Note that data tracked is for the window 00:00 GMT Friday, Nov 27 to 12:00 GMT Saturday Nov 28. 9) Device Usage – Search event originating from type of device. All events originating from other than Mobile or Desktop have been aggregated in “Tablet & Others”. 10) Top 5 Countries – CTR – Actual CTR ratios per country may differ. Represented CTR ratios are indicative based on the data window from 00:00 GMT Friday, Nov 27 to 12:00 GMT Saturday Nov 28. 11) Top 5 Countries – CCR – Actual CCR ratio per country may differ. Represented CTR ratios are indicative based on the data window from 00:00 GMT Friday, Nov 27 to 12:00 GMT Saturday Nov 28. 12) Top Industries by Region – Actual revenue share per each industry may differ. Revenue data represented accounts for 50% stores for the window from 00:00 GMT Friday, Nov 27 to 12:00 GMT Saturday Nov 28.
Klevu